Managing a project means juggling tasks, deadlines, and deliverables – and doing it all in a way that keeps your team aligned. One proven tool makes this easier: the Gantt chart.
In this guide, we’ll explore what a Gantt chart is, how Microsoft Project uses it, why it’s so effective for managing projects, and how it compares to tools like Asana and Trello. You’ll also find real-world use cases, practical tips, and helpful templates from Auscomp.com.
What is a Gantt Chart?
A Gantt chart is a type of bar chart that visually illustrates a project schedule. Each task is represented as a horizontal bar on a timeline, where the bar’s length shows its duration and the start and end points indicate when the task begins and finishes.
Tasks are listed vertically, and time intervals span the horizontal axis. This format clearly shows what’s scheduled, when tasks start and end, and how they relate to one another. This visual clarity makes it easy to track overlaps, durations, and sequencing.
Modern Gantt charts often go beyond the basics. They may include:
- Dependencies, which show how tasks relate to each other
- Milestones, marking significant project events
- Progress indicators, which display how much of a task is complete
These additional features allow Gantt charts to reflect project dynamics in real time, helping teams manage complexity more effectively.
Developed in the early 1900s by Henry Gantt, this method has remained relevant across more than a century of project management because it meets a fundamental need: turning abstract plans into a clear timeline.
How Microsoft Project Uses Gantt Charts
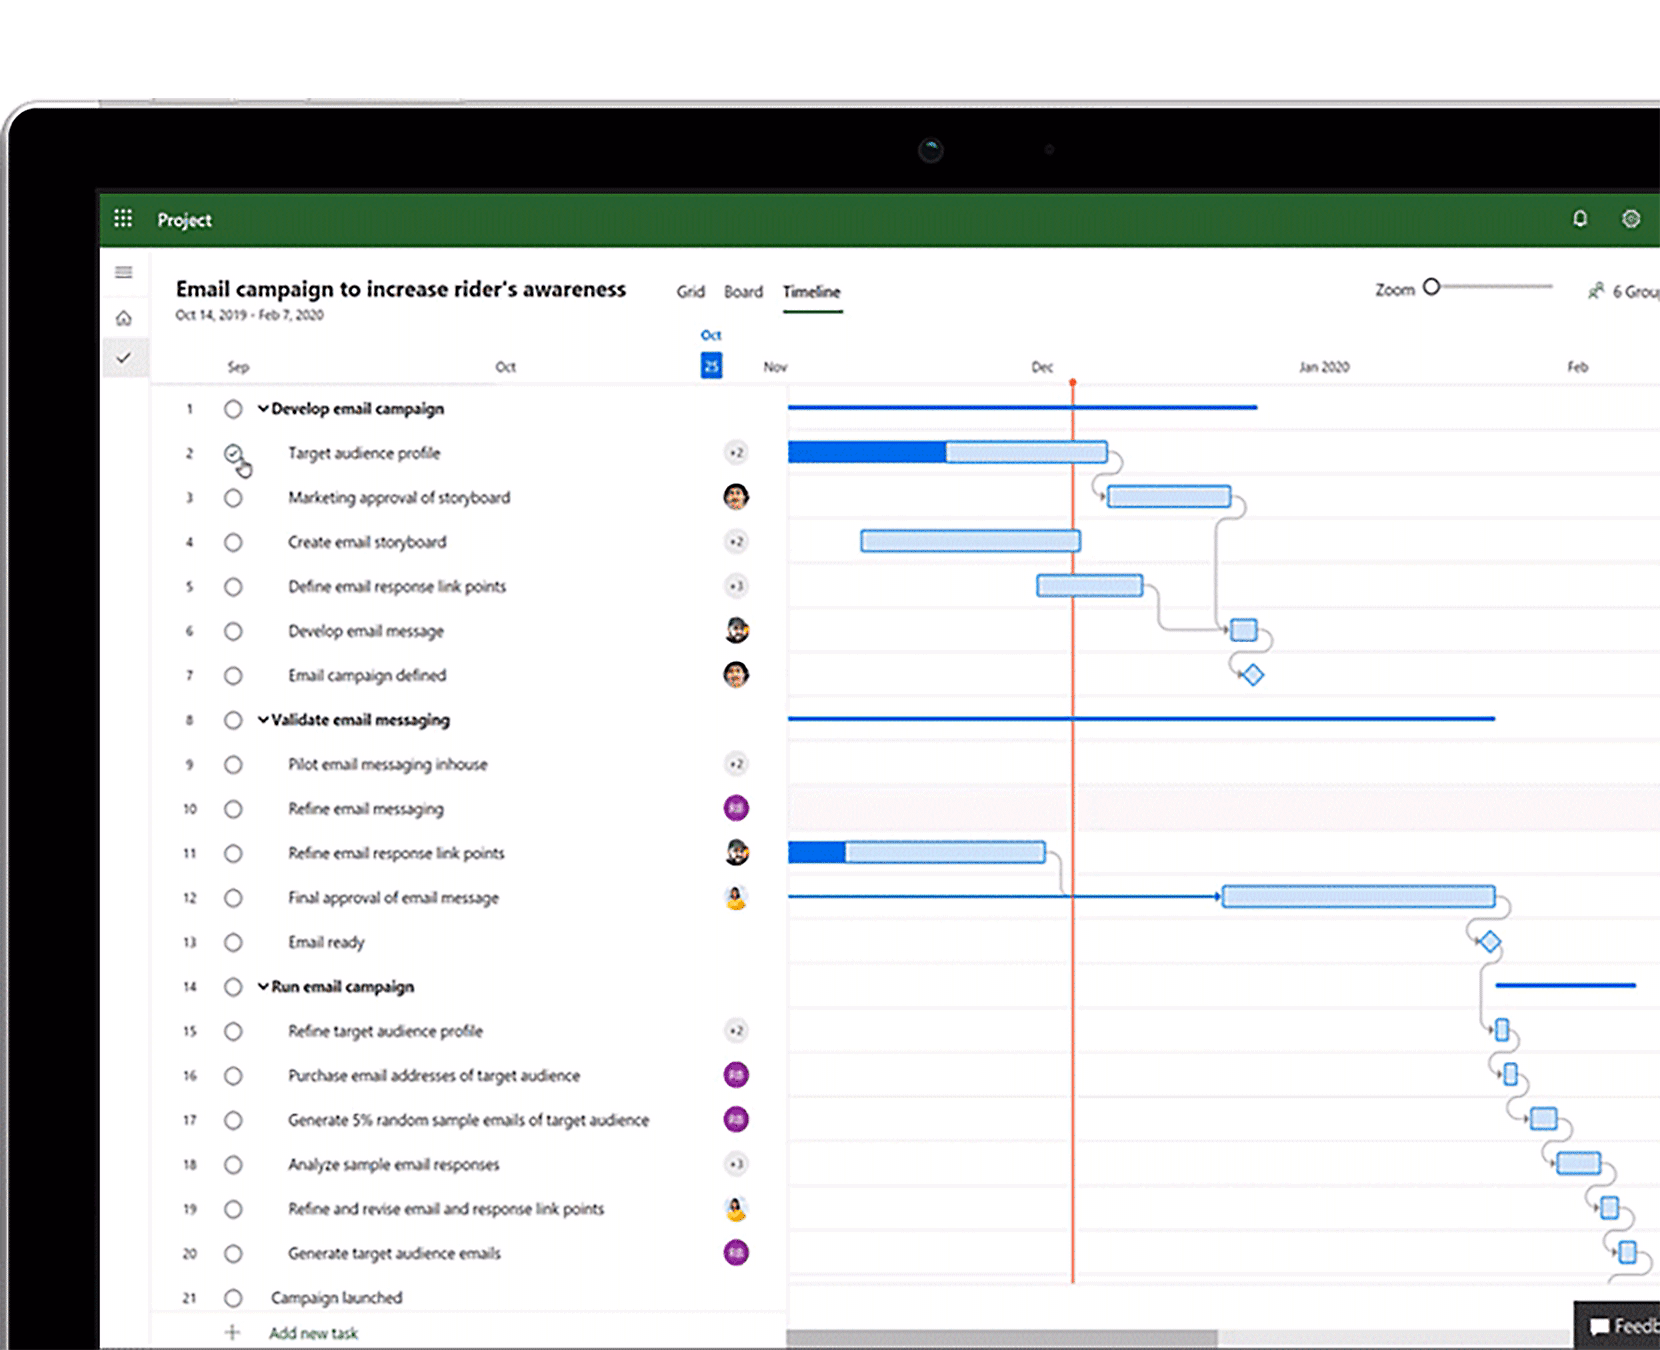
Microsoft Project is centred around the Gantt Chart view — the default interface when you start a new project. You’ll see a dual-pane layout:
- On the left, a spreadsheet-style task list
- On the right, a timeline showing bars for each task
Each bar begins at the task’s start date and ends at its finish date. Tasks linked by dependencies are joined with arrows, and summary tasks can be collapsed or expanded for easier viewing.
Zoom levels let you switch between day-by-day planning and long-range forecasting. Interactivity is a major strength — you can drag tasks to new dates, draw dependencies directly on the chart, and immediately see how those changes affect the overall timeline.
Key Gantt features in MS Project include:
- Customisable bar formats (colour, shape, labels)
- Task filters and groupings
- Highlighting of critical paths and slack time
- Support for multiple baselines to track changes
- Views for cost, workload, and resource allocation
Microsoft Project’s Gantt charts are not static illustrations — they are dynamic planning tools that adapt as your project evolves.
Why Gantt Charts Matter in Project Management
Gantt charts transform abstract planning into structured, visual workflows. Their value extends across several project functions:
Visualise the Entire Project
You can see every task, when it starts and ends, and how it fits into the broader project. This complete timeline helps spot potential gaps or overlaps before they become problems.
Improve Scheduling and Coordination
Seeing task dependencies makes it easier to schedule work in a logical order and avoid resource conflicts. Project managers can use this view to balance workloads and prevent bottlenecks.
Track Progress Transparently
By updating each task with actual start and finish dates or per cent complete, the Gantt chart becomes a live progress tracker. Variance from the baseline is immediately visible.
Promote Team Alignment
Gantt charts help teams understand their responsibilities and how delays affect others. They support clearer communication between team members, stakeholders, and clients.
Respond to Change with Agility
Adjustments are intuitive — simply drag and drop or reassign tasks. With dependencies in place, the schedule recalculates instantly. When paired with a baseline, the impact of those changes becomes quantifiable.
In essence, Gantt charts are both roadmap and reporting tools, serving as the foundation for planning, tracking, and adapting.
Real-World Use Cases
Construction Projects
From initial blueprints to final inspections, construction projects are full of sequential dependencies. Gantt charts help coordinate architecture, permitting, structural work, and more. When delays occur — such as with material deliveries — the chart highlights knock-on effects instantly.
Software Development
For agile or waterfall teams, Gantt charts help align development phases, testing, bug fixes, and deployment. Dependencies between frontend and backend work become easier to manage. Resource conflicts — like overbooked developers — can also be addressed early.
Marketing Campaigns
Content creation, social scheduling, PR outreach, and launch events all run on strict deadlines. Gantt charts offer a visual campaign calendar so teams stay on track and dependencies are not overlooked (e.g. needing content before ads can go live).
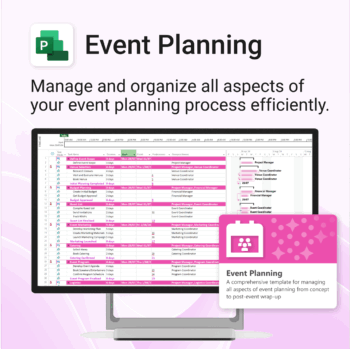
Event Planning
Every moving part — from venue booking to vendor coordination to attendee communication — can be mapped. Gantt charts help avoid surprises and ensure all critical tasks finish on time.
Explore Auscomp’s Event Planning for MS Project Template — designed to simplify even the most complex events.
Other Use Cases:
- Education: scheduling assignments and curriculum
- Nonprofits: tracking grant cycles and outreach
- Manufacturing: managing production and supply chains
- IT teams: coordinating infrastructure upgrades or cloud migrations
Any project with defined phases, timelines, and deliverables benefits from a well-structured Gantt chart.
MS Project vs Asana vs Trello: How They Stack Up
Microsoft Project offers the most robust Gantt chart functionality. It’s built for professional project managers and includes advanced features like critical path, resource levelling, and multi-project scheduling. Requires training but offers unmatched depth.
Asana introduced a Timeline view to provide Gantt-like scheduling. It supports dependencies and drag-and-drop rescheduling but lacks deeper features like auto-calculated critical paths. A good choice for mid-sized teams needing visual planning without complexity.
Trello is A Kanban-based tool by default. Trello does not offer native Gantt charts unless extended with third-party power-ups like TeamGantt. Ideal for flexible, visual task tracking rather than full-fledged scheduling.
Summary
- Choose MS Project for complex, resource-intensive projects
- Choose Asana for collaborative planning and simplicity
- Choose Trello for agile teams who occasionally need timeline views
Some teams even use a hybrid approach — managing the master schedule in MS Project while coordinating daily tasks in Asana or Trello.
Tips for Better Gantt Charts in Microsoft Project
Start with a Work Breakdown Structure (WBS)
Break down the project into manageable phases and tasks. Use summary tasks to organise and collapse large sections for better clarity.
Establish Task Dependencies Early
Link tasks logically using appropriate dependency types (e.g. Finish-to-Start, Start-to-Start). This ensures the schedule adjusts automatically if timelines shift.
Use Milestones Strategically
Milestones highlight key achievements or deadlines. They help orient the team and provide fixed points for tracking progress.
Avoid Visual Overload
Keep the chart readable by filtering views and using colour-coded bars for phases or priorities. Use roll-ups and collapsible sections for large projects.
Maintain Regular Updates
Treat your Gantt chart as a living document. Enter task progress, update dates, and track percentage complete frequently to maintain accuracy.
Set and Monitor Baselines
Capture your original plan to assess how current performance compares. Use variance reports to identify trends and risks.
Leverage Reports and Alternate Views
Use built-in views like Timeline, Resource Usage, or Task Usage to complement the Gantt chart. Reports like “Late Tasks” or “Overallocated Resources” provide deeper insights.
Use Templates for Efficiency
If you regularly manage similar projects, templates save time and ensure consistency. Auscomp offers customisable MS Project templates tailored to different industries and goals.
Final Thoughts
A Gantt chart is more than a schedule — it’s a living system for turning plans into outcomes. With Microsoft Project, you get a powerful environment for building, refining, and executing those plans.
Whether you’re overseeing a construction build, a product launch, or an internal IT upgrade, a Gantt chart provides the structure to stay organised, communicate clearly, and adapt with confidence.
If you’re ready to get started:
- Open Microsoft Project
- Create your WBS and timeline
- Explore Auscomp’s templates to fast-track your setup
- Microsoft Project Tutorial: A Comprehensive Guide for Efficient Professionals