Visual Store Intelligence. 100% Private.

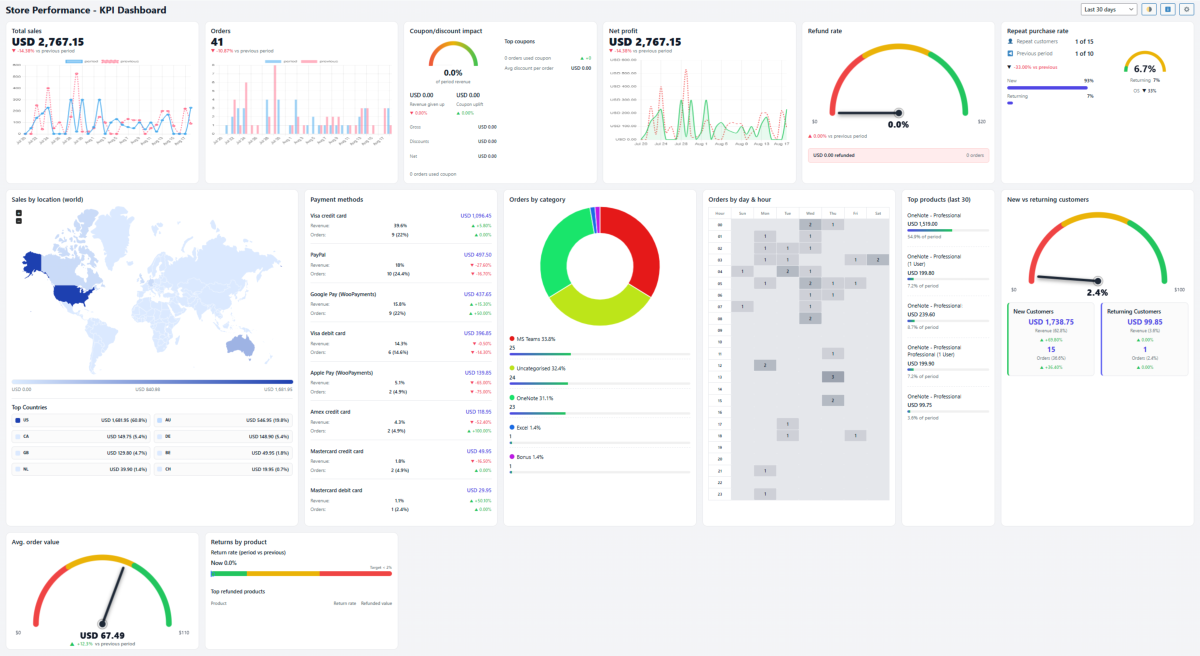
Store Analytics for WooCommerce gives you a modern, visual dashboard that turns your store data into instant insight—without sending a single byte to the cloud. Everything is computed locally in your WordPress environment, right in the browser.

What you get

  • 14 interactive KPI cards: Total Sales, Orders, Net Profit, AOV, Refund Rate, New vs Returning, Repeat Purchase Rate, Coupon/Discount Impact, Payment Methods, Top Products, Orders by Category, Returns by Product, Hour-by-Hour Heatmap, and Global Sales Map.
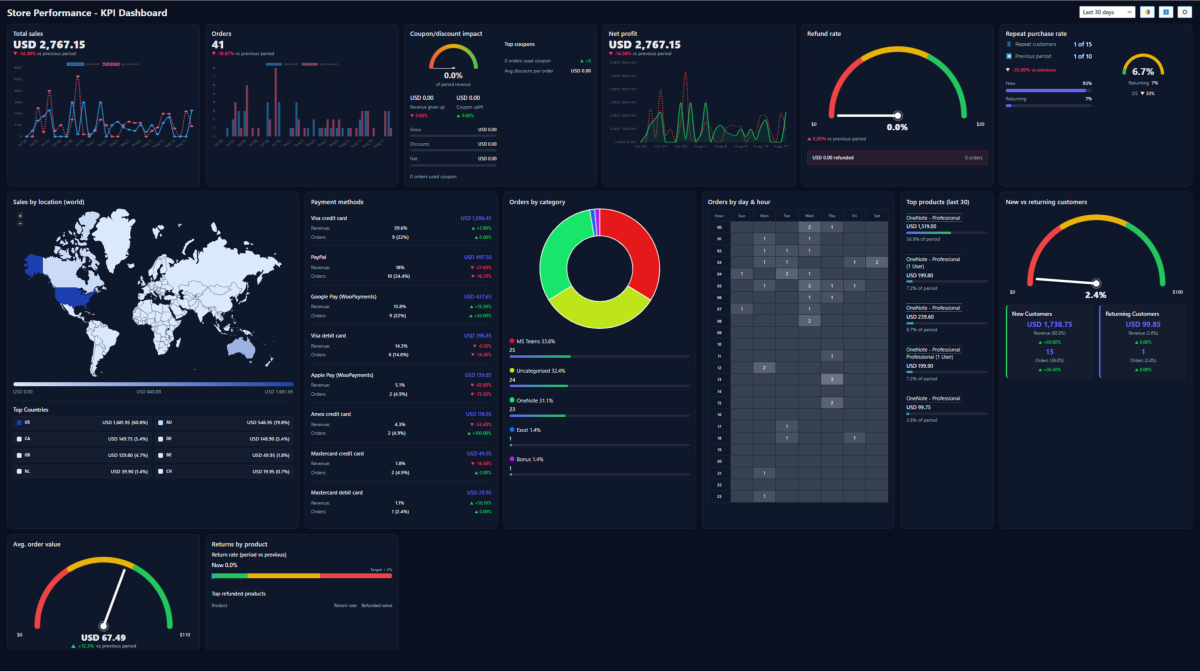
  • Clean, responsive UI with light/dark mode.
  • Rich tooltips, trend deltas, and compact comparisons (e.g., vs previous period).
  • Drag-and-drop card layout and per-card sizing.
  • Zero setup—works with your existing WooCommerce data.

Private by Design

All calculations run in your browser on your own WordPress site. No external services. No tracking. No data export. Your store stays your store.

Compare FREE vs. PRO plugin

What’s included Free
$0
1 site • 1-year updates
Pro
$99 $59
one-time • 1 site
LICENSE & SUPPORT
Site license 1 site 1 site
Plugin updates 1 year 1 year
Support No Yes
Settings / customizations Basic Full
KPIs & VISUALS (14 TOTAL)
Total sales
Orders
Net profit
Orders by category
Avg. order value
Refund rate
Repeat purchase rate
Sales by location (world map)
Payment methods
Orders by day & hour (heatmap)
Top products (last 30)
New vs returning customers
Coupon / discount impact
Returns by product
Download Free Get Pro — $59

⚠️ Requirements

To use Store Analytics for WooCommerce you need to have WooCommerce installed.

No Sign-Up. Just Download & Go.

Store Analytics for WooCommerce
Free Version — Yours forever.

Flexible Date Filters, Light/Dark Modes & Dashboard Settings

Flexible Date Filters & Theme Modes — Compare Any Timeframe

Drill down into the period that matter.

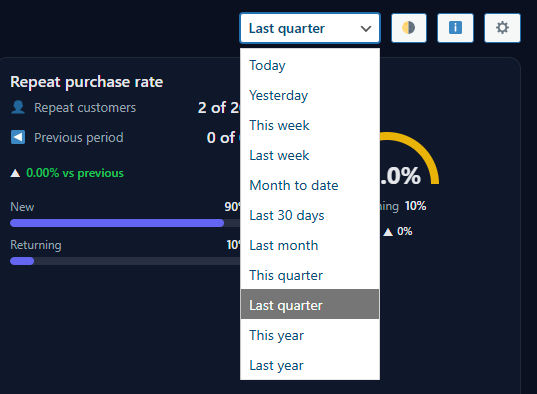
Customise your KPI dashboard with dynamic date filters and theme options. Quickly switch between common timeframes or compare trends across weeks, months, quarters, or years — all while choosing between light or dark mode to match your preference.

Key points

  • Predefined options: today, yesterday, this week, last week, month-to-date, last 30 days, last month, this quarter, last quarter, this year, last year
  • Instant recalculation of all KPIs and charts
  • Enables fast period-to-period performance comparison
  • Streamlined dropdown interface for quick selection
  • Toggle between light and dark modes for better readability

Dashboard Settings – Customize Your KPIs

Your dashboard, your way.

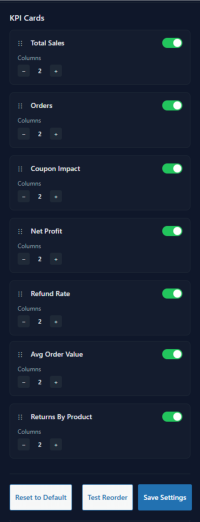
Personalize the WooCommerce KPI Dashboard to match your workflow. Choose which KPI cards to display, adjust the layout, and reorder widgets with ease.

Key points

  • Toggle individual KPI cards on or off
  • Adjust the number of columns per widget
  • Drag-and-drop to reorder KPI blocks
  • Save your custom layout or reset to default anytime

Your Store, Measured in 14 Ways


Trends, heatmap, world map, and more—no cloud, no tracking.

Total Sales — Revenue, trended & compared

See what you made and how it’s moving, at a glance.

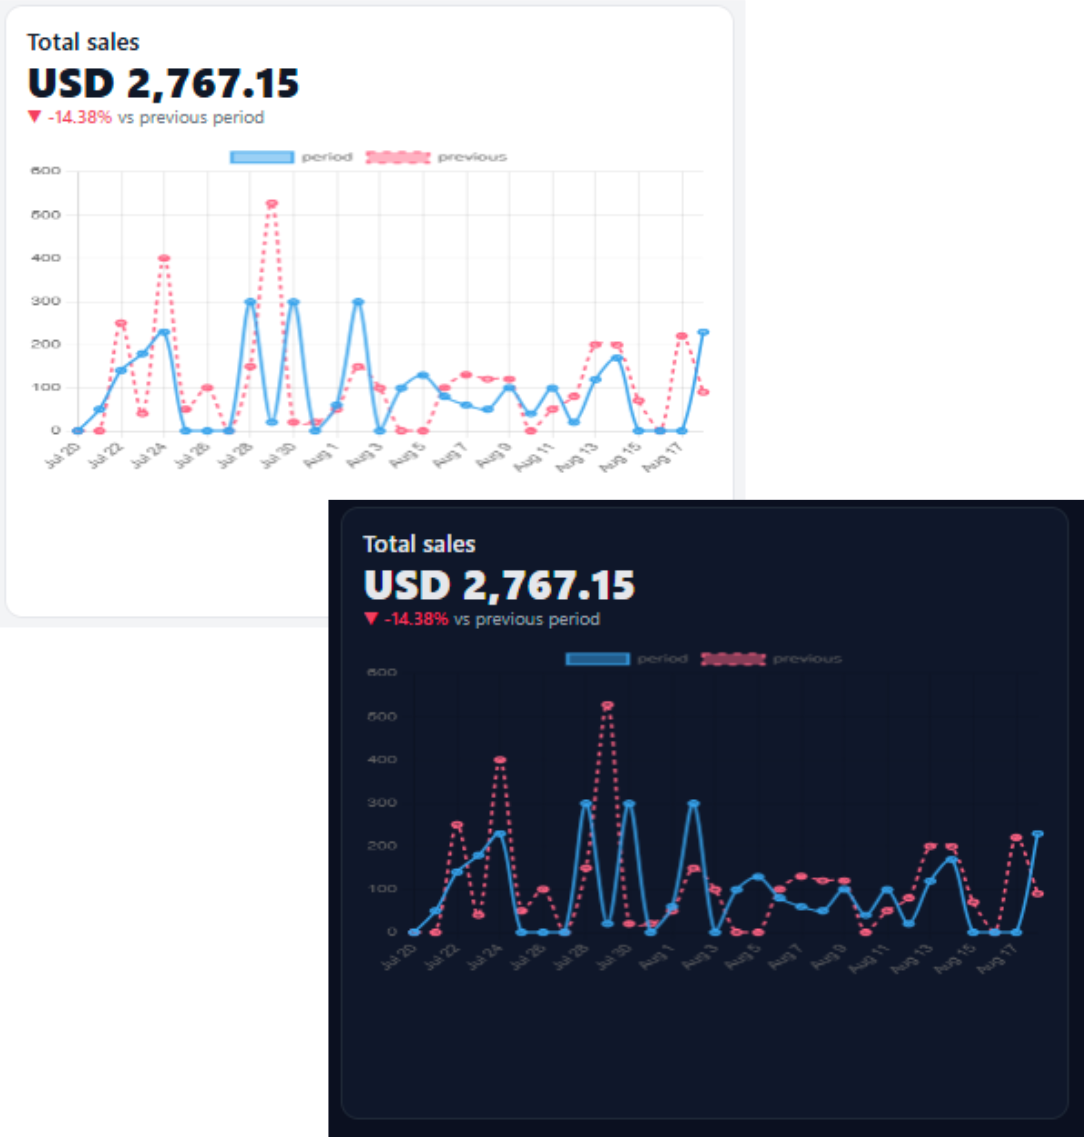
Track gross revenue for any period with a clean line chart that overlays the previous period and calls out the % change. Perfect for spotting spikes and dips, measuring campaigns, and keeping a pulse on growth.

Key points

  • Current period total with % vs previous period
  • Dual trend lines: period vs previous for instant benchmarking
  • Hover tooltips for day-by-day (or week/month) subtotals
  • Works with all your store’s currencies and date presets
  • Renders locally in your browser — no cloud, no tracking

Orders — Volume, trended & compared

See demand at a glance—day by day, current vs previous.

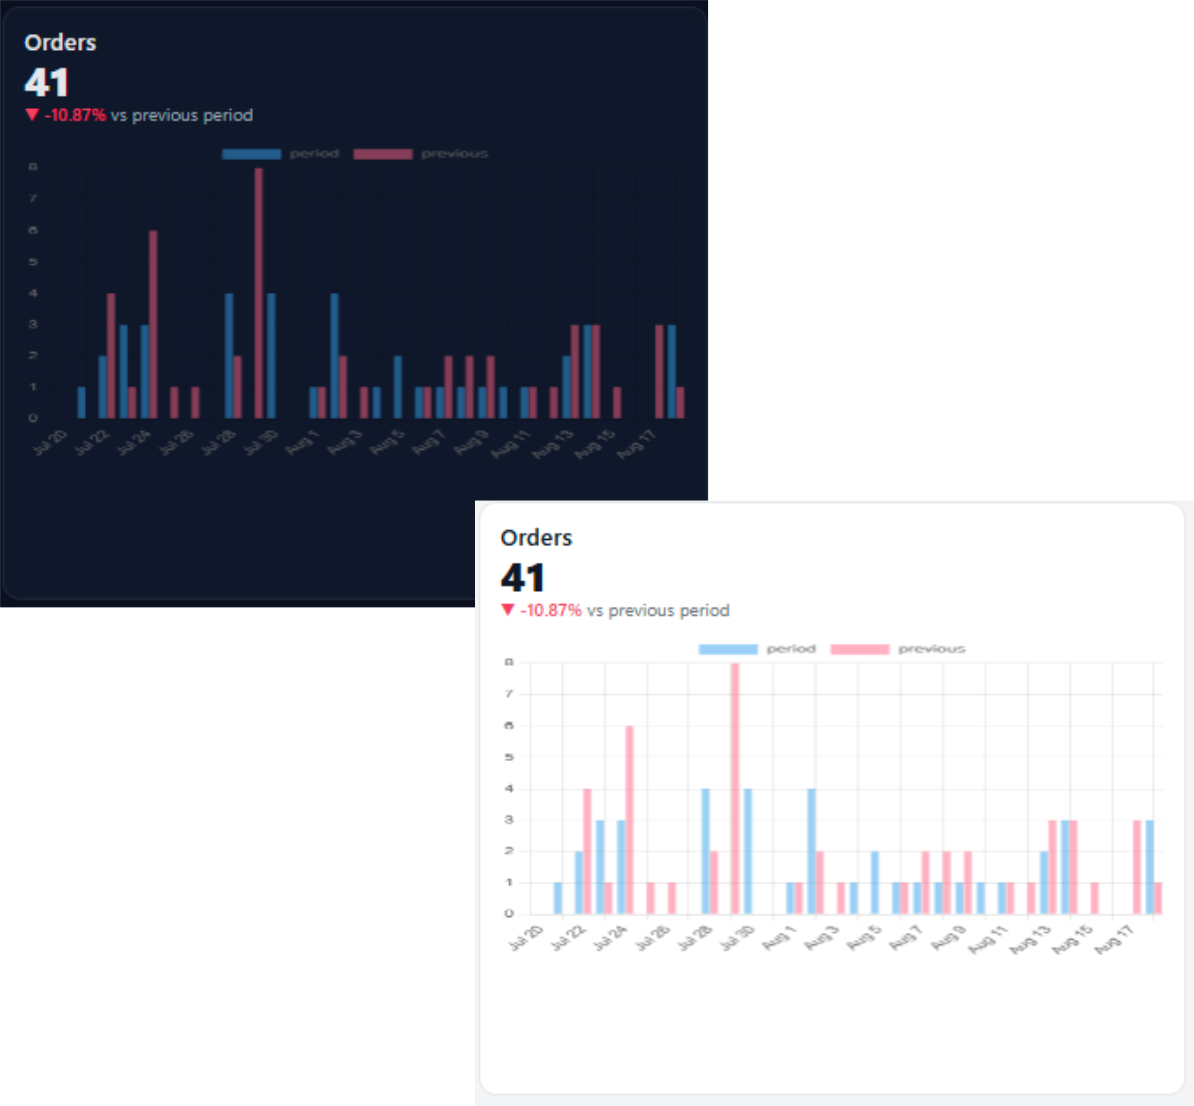
Track how many orders you’re getting and how it’s changing over time. A clean bar chart compares the selected period with the previous one so you can spot spikes, dips, and day-of-week patterns fast. Great for measuring campaign lift, seasonality, or stockout impacts—and it pairs perfectly with AOV to infer revenue.

Key points

  • Current period overlaid with previous period for instant context
  • Hover tooltips for exact daily/weekly/monthly counts
  • Quickly identify promotional spikes and timing
  • Combine with AOV to estimate revenue impact
  • Renders locally in your browser inside WordPress—no cloud, no tracking

Orders by Category – Visual Breakdown

See exactly what’s selling, at a glance.

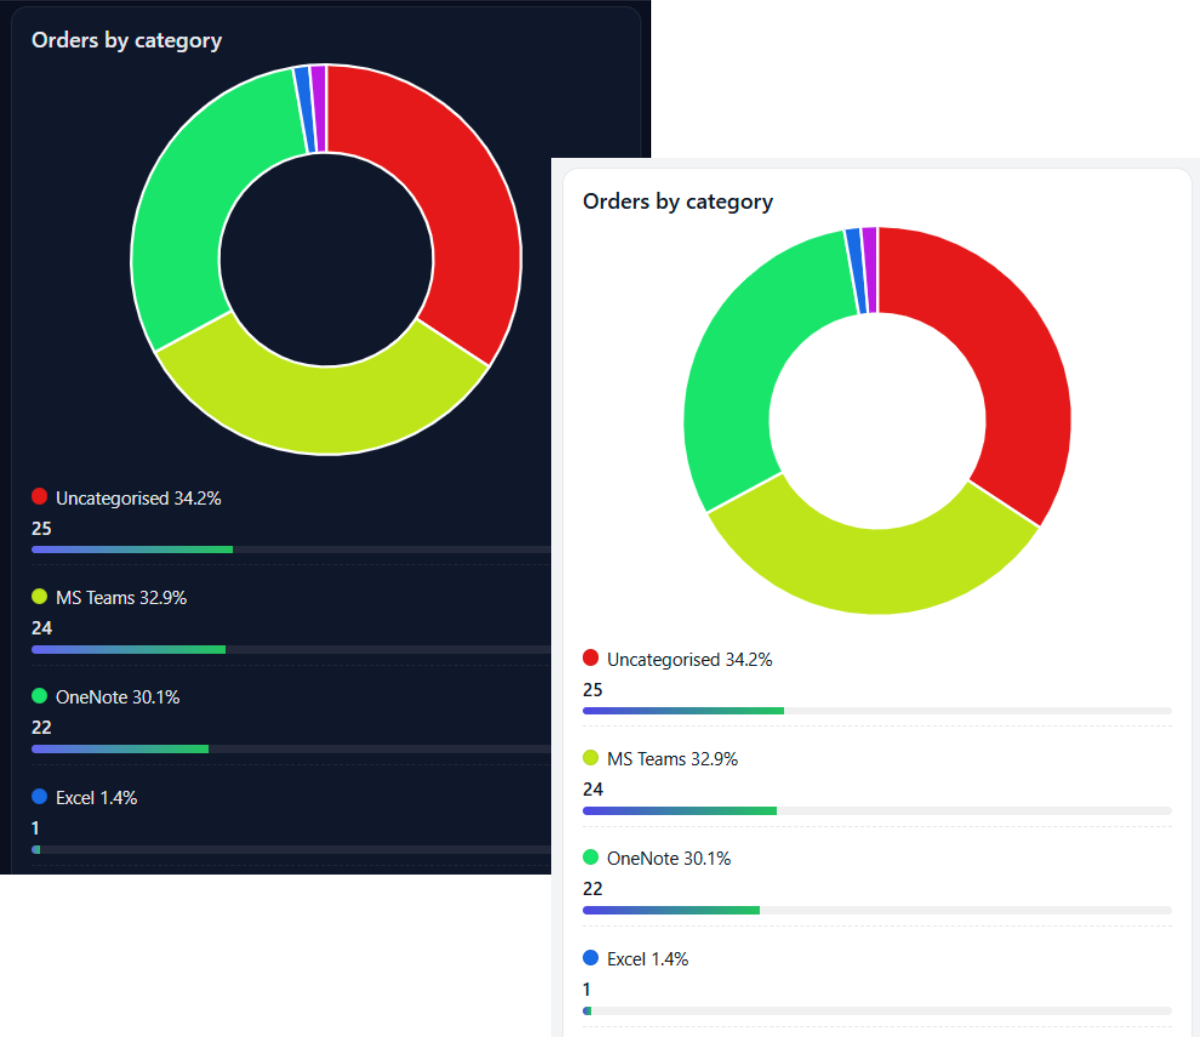
Track your WooCommerce sales distribution with an interactive donut chart and percentage bars. Instantly understand where revenue comes from and how product categories compare.

Key points

  • Donut chart with real-time order shares
  • Percentage breakdown with colour indicators
  • Category counts with progress bars
  • Light & dark theme support

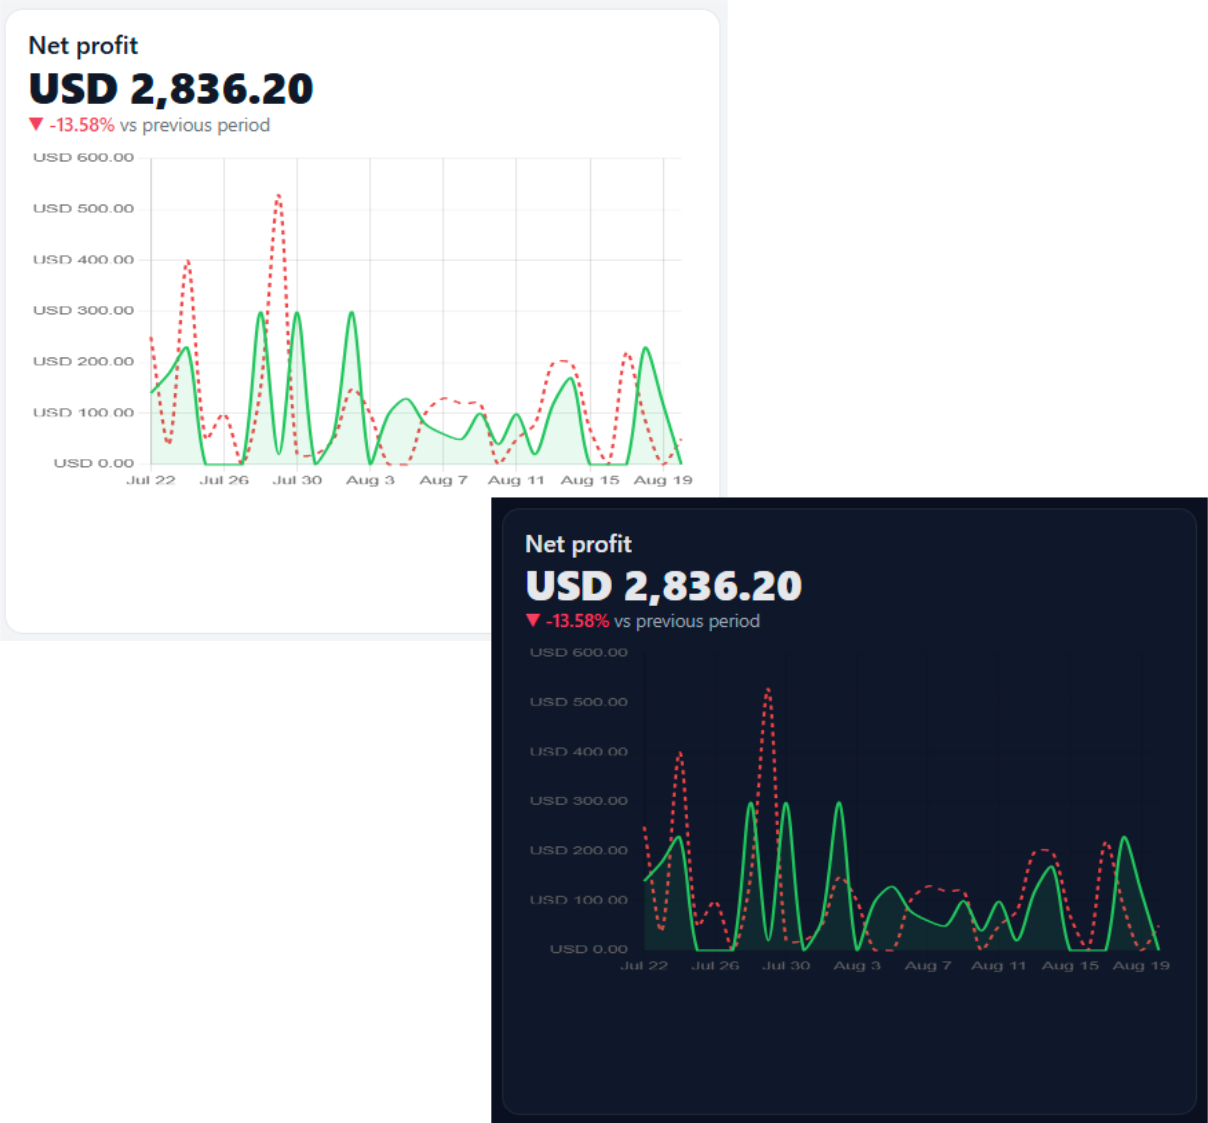
Net Profit – Real-Time KPI Tracking

Turn your profit trends into decisions.

Monitor net profit and performance trends directly inside WordPress. Visualise margins with line graphs, compare against past periods, and spot fluctuations instantly.

Key points

  • Real-time profit tracking
  • Comparison vs previous period
  • Visual indicators (green/red up & down trends)
  • Interactive line & dotted reference charts

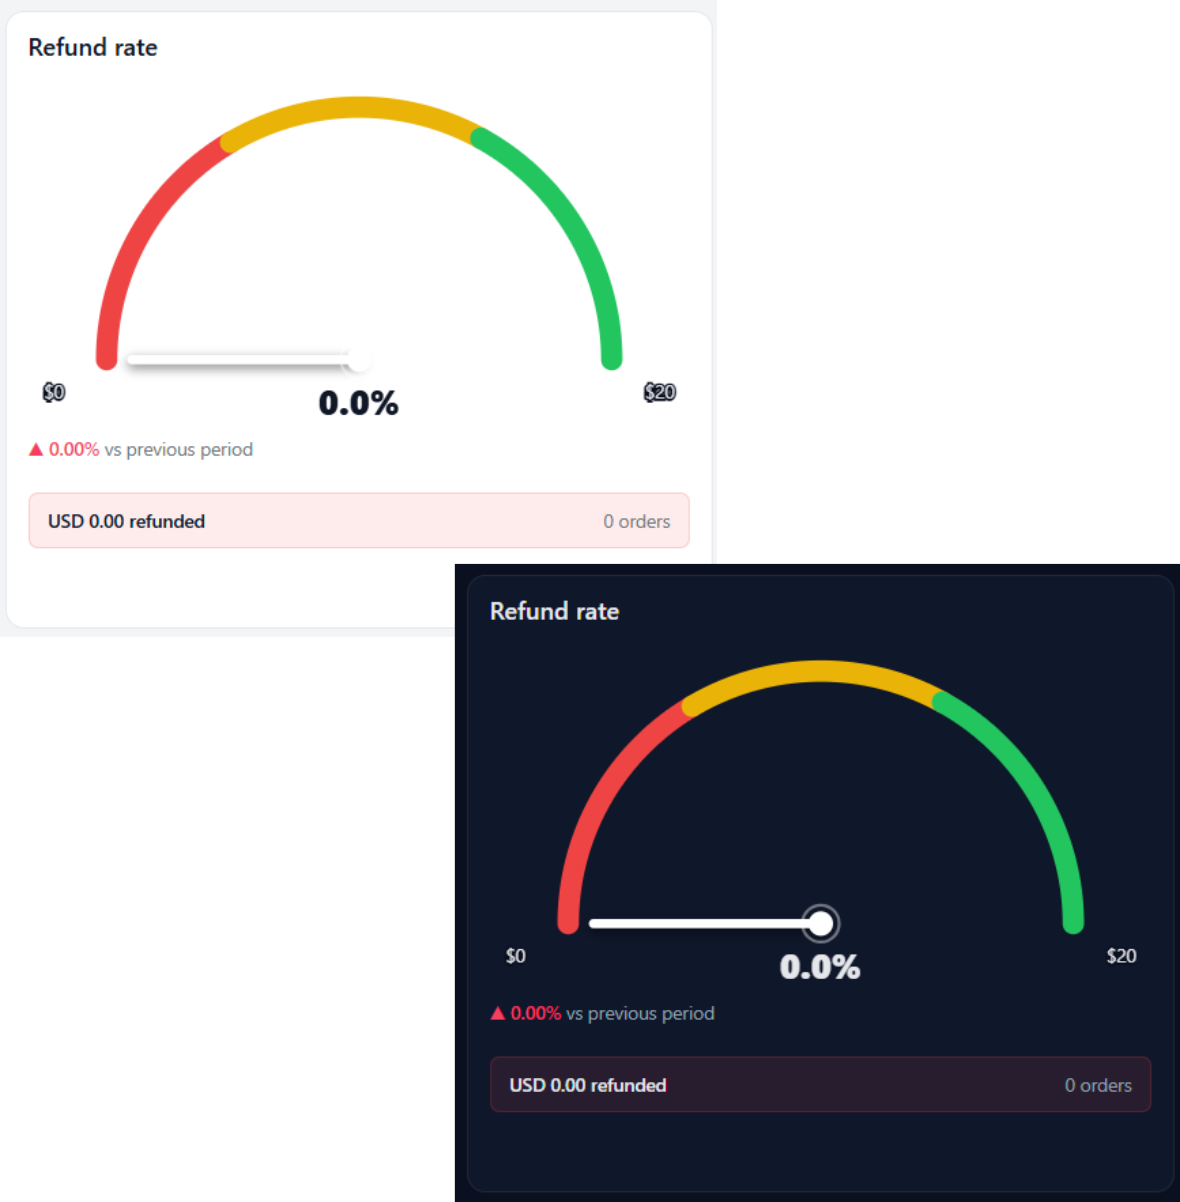
Refund Rate – Customer Satisfaction Indicator

Keep returns under control.

Track refund activity with an easy-to-read gauge that highlights your store’s return trends. Compare against previous periods to stay on top of customer satisfaction.

Key points

  • Colour-coded speedometer for instant clarity
  • Real-time percentage of refunded orders
  • Dollar amount and order count displayed
  • Comparison with previous period

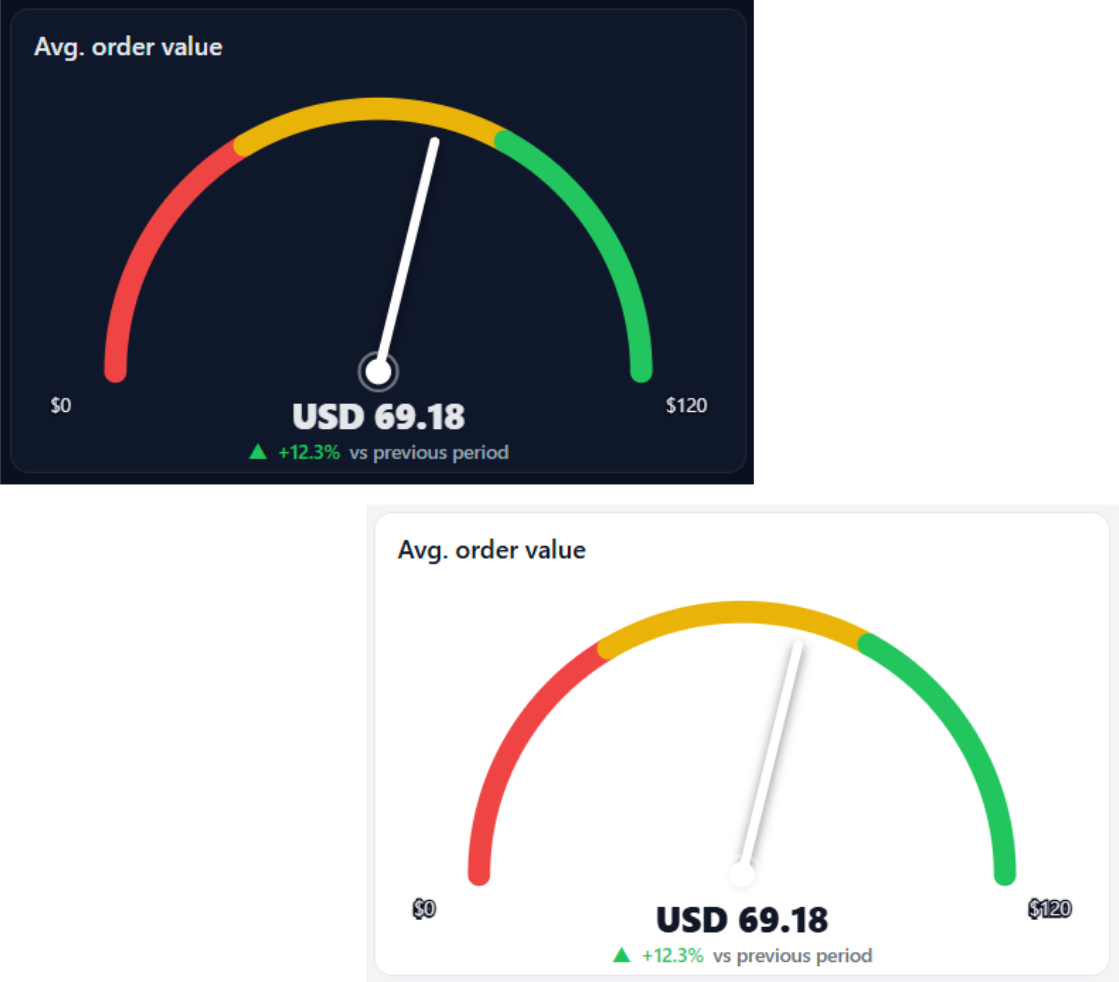
Average Order Value – Profit Growth Tracker

See what every order is really worth.

Monitor your store’s average order value to understand spending patterns and drive growth. The KPI gauge shows changes over time with clear performance indicators.

Key points

  • Dynamic speedometer displaying average spend
  • Dollar value updated in real time
  • Comparison with past performance
  • Visual trend indicator (increase or decrease)

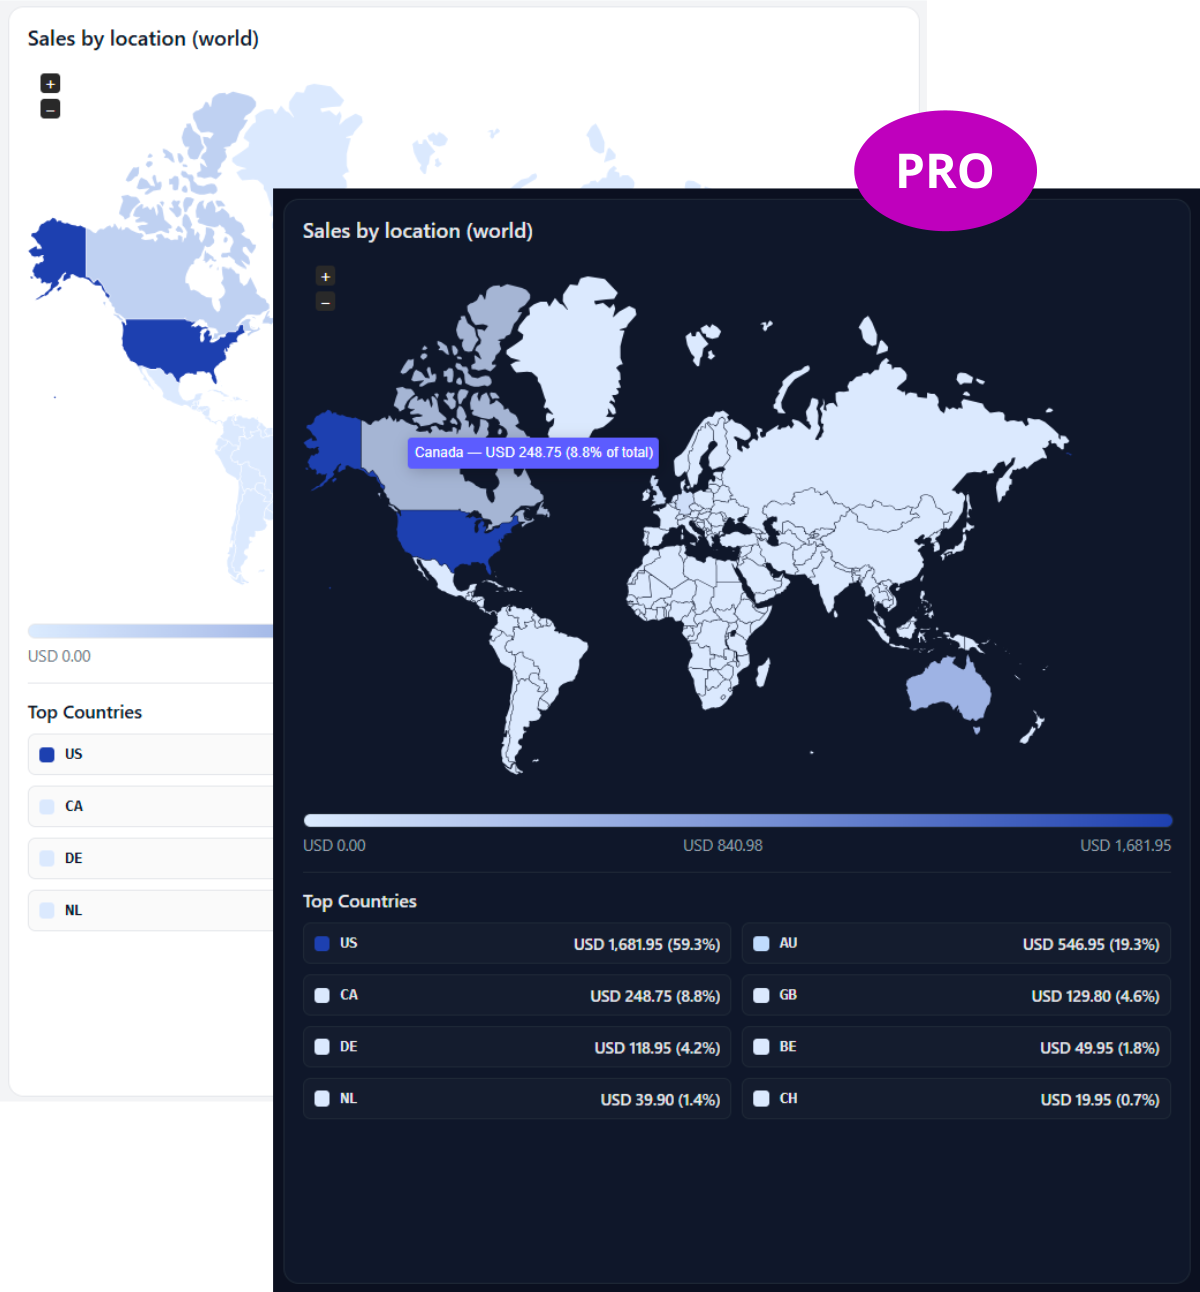
Sales by Location – Interactive World Map (PRO Version)

See where your sales come from.

Visualize sales across the globe with an interactive map and country-level breakdown. Track revenue concentration and identify your top-performing regions.

Key points

  • Interactive world map with country shading
  • Real-time sales value per country
  • Top country list with revenue share
  • Compare global vs local sales distribution

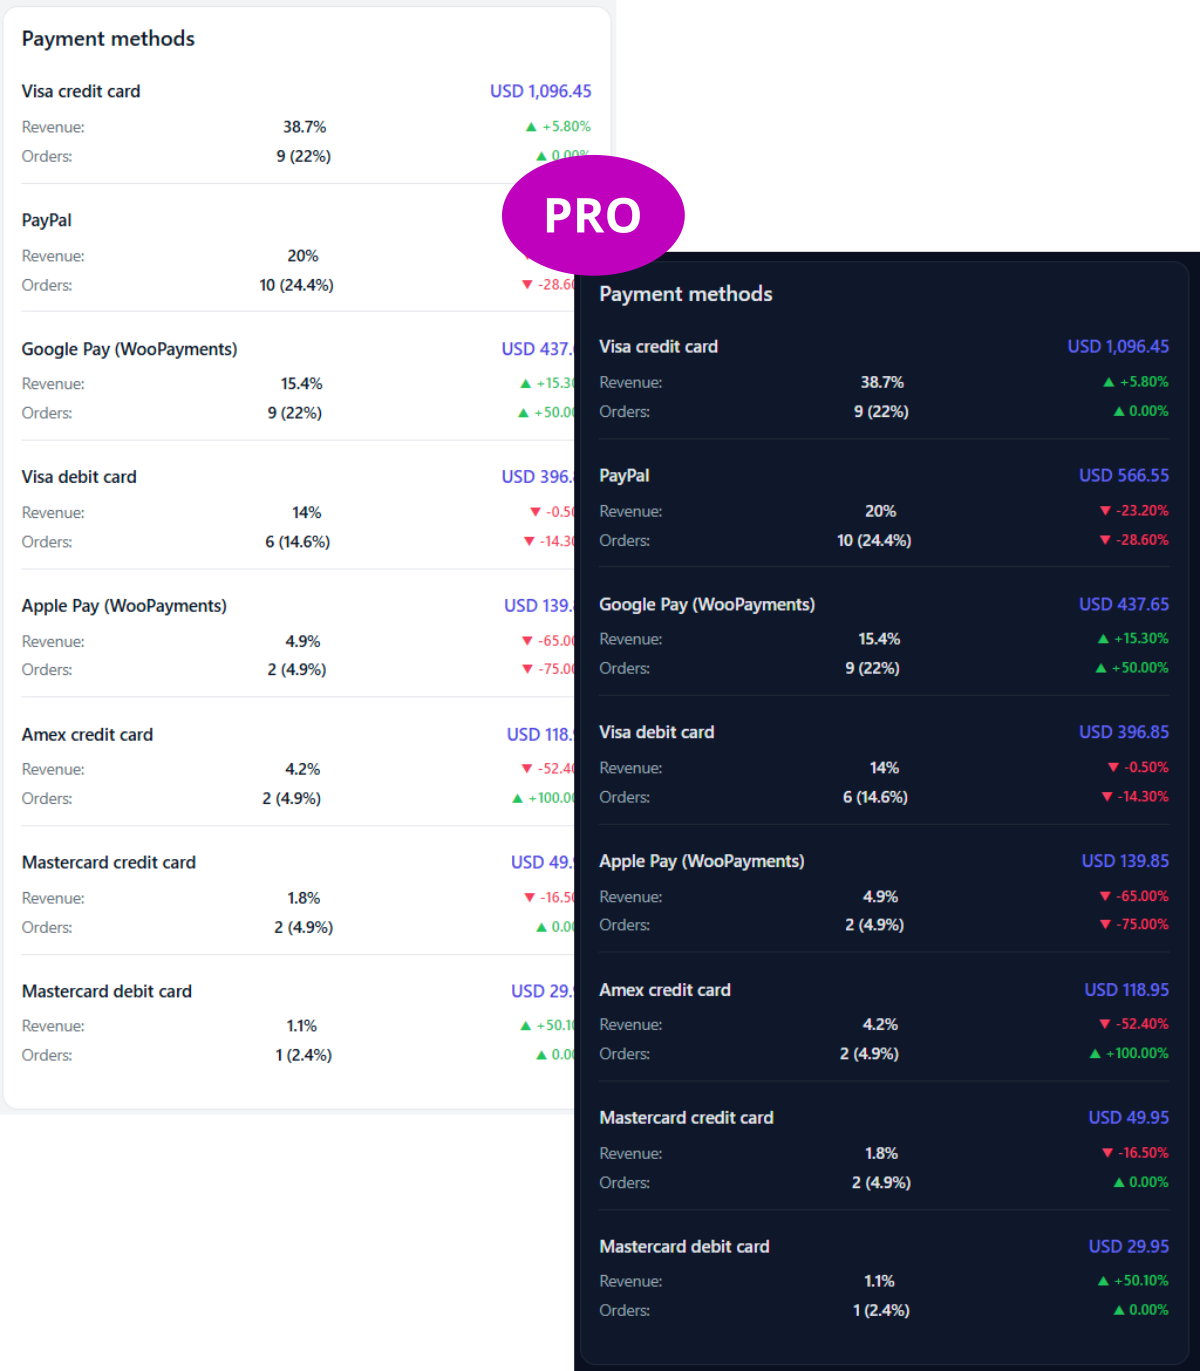
Payment Methods – Revenue Split by Gateway (PRO Version)

Know how customers pay.

Analyze order distribution across different payment methods to understand customer preferences and optimize checkout performance.

Key points

  • Revenue and order share per payment type
  • Percentage breakdown with trends vs previous period
  • Clear view of payment method performance
  • Supports all WooCommerce gateways

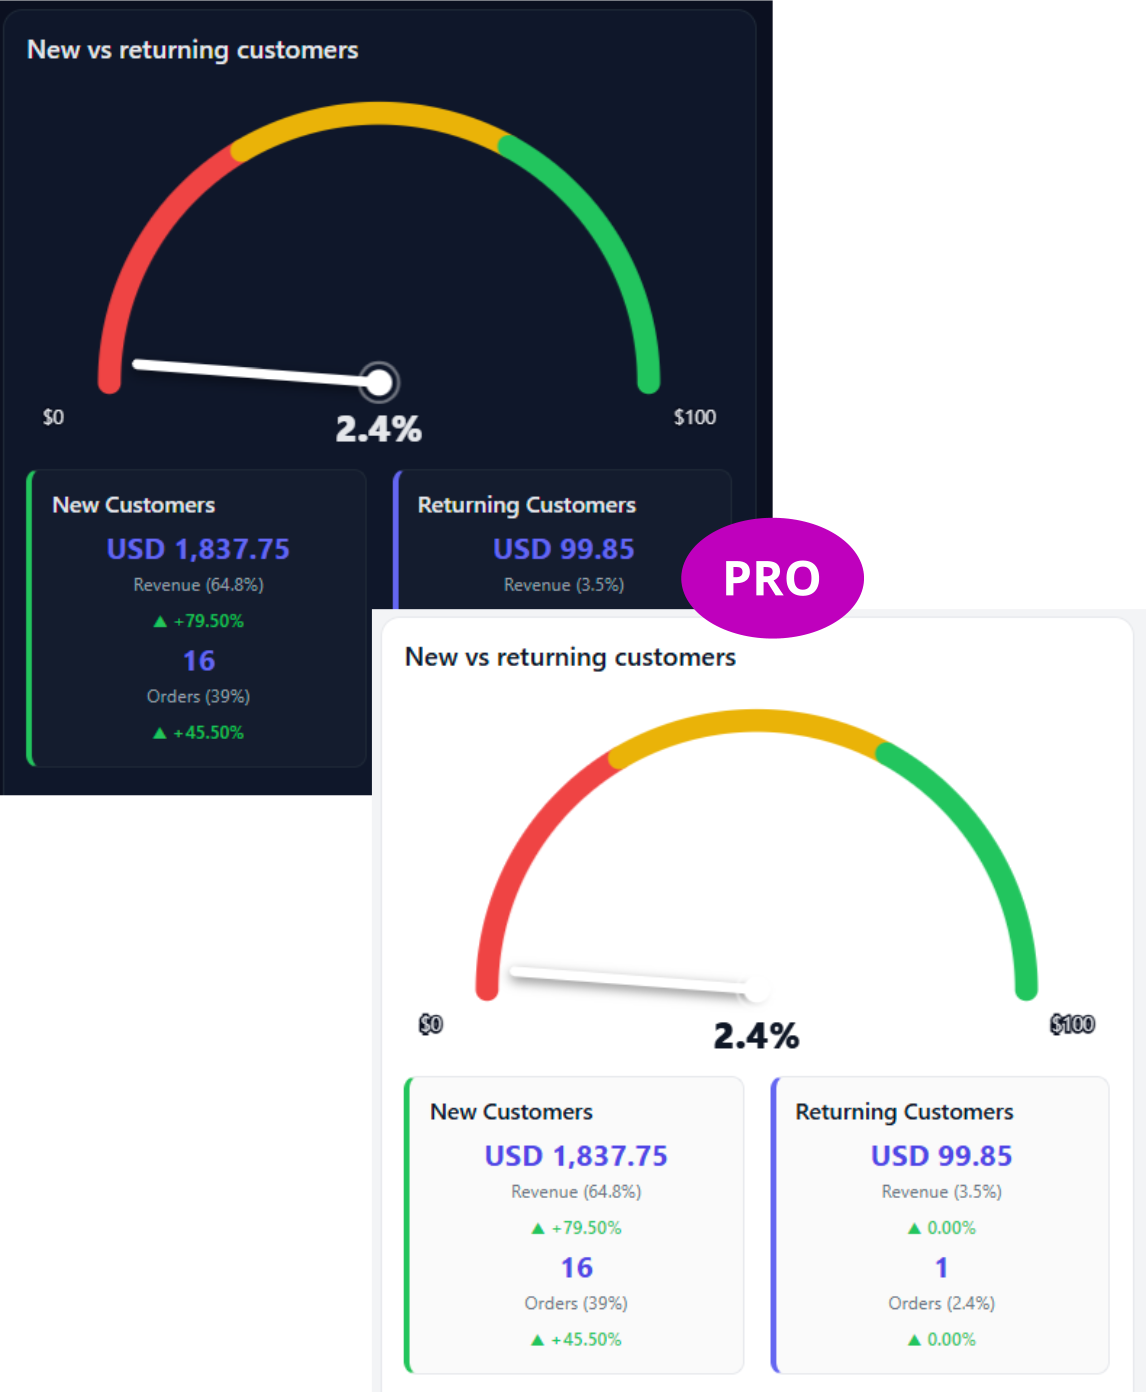
New vs Returning Customers – Loyalty Insights (PRO Version)

Measure acquisition and retention side by side.

Compare the revenue impact of new versus returning customers with a visual KPI gauge and detailed breakdown of orders and sales contribution.

Key points

  • Speedometer showing customer type ratio
  • Revenue split between new and returning customers
  • Real-time order counts and percentages
  • Growth and retention trend comparison

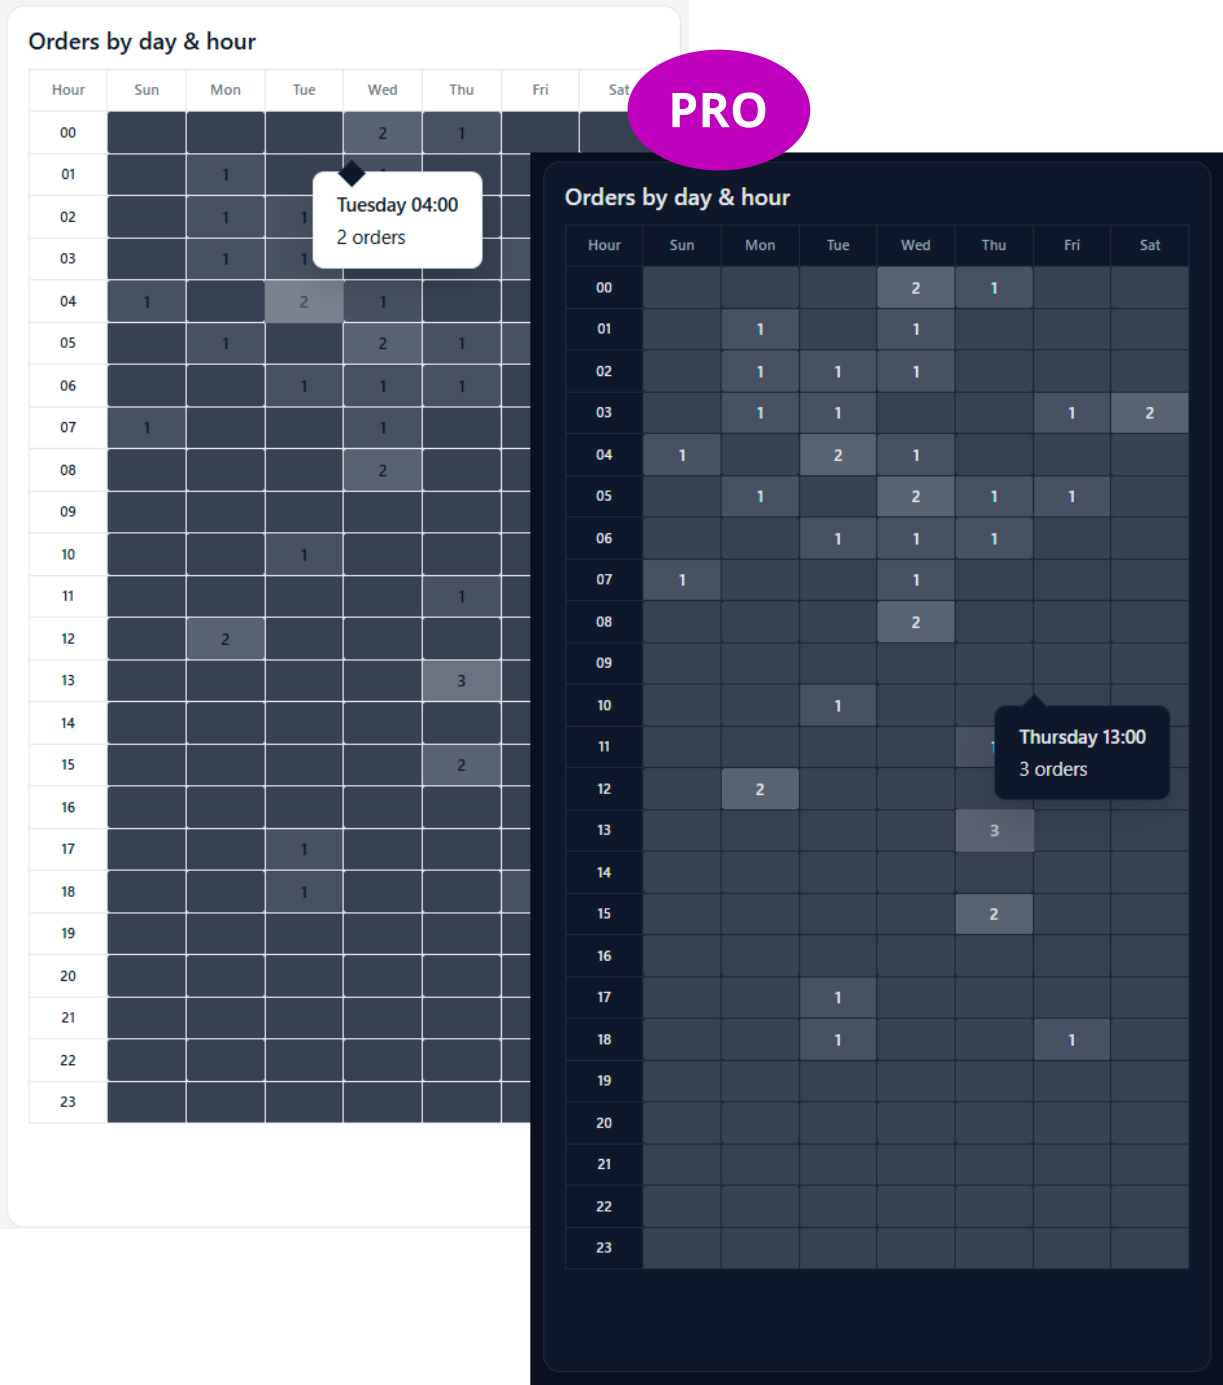
Orders by Day & Hour – Sales Heatmap (PRO Version)

Spot when customers buy most.

Identify peak shopping times with an interactive heatmap showing order volumes by day of the week and hour of the day.

Key points

  • Grid-based heatmap with real-time order data
  • Easy comparison of sales activity across hours and days
  • Tooltip details for precise order counts
  • Helps optimize promotions and staffing

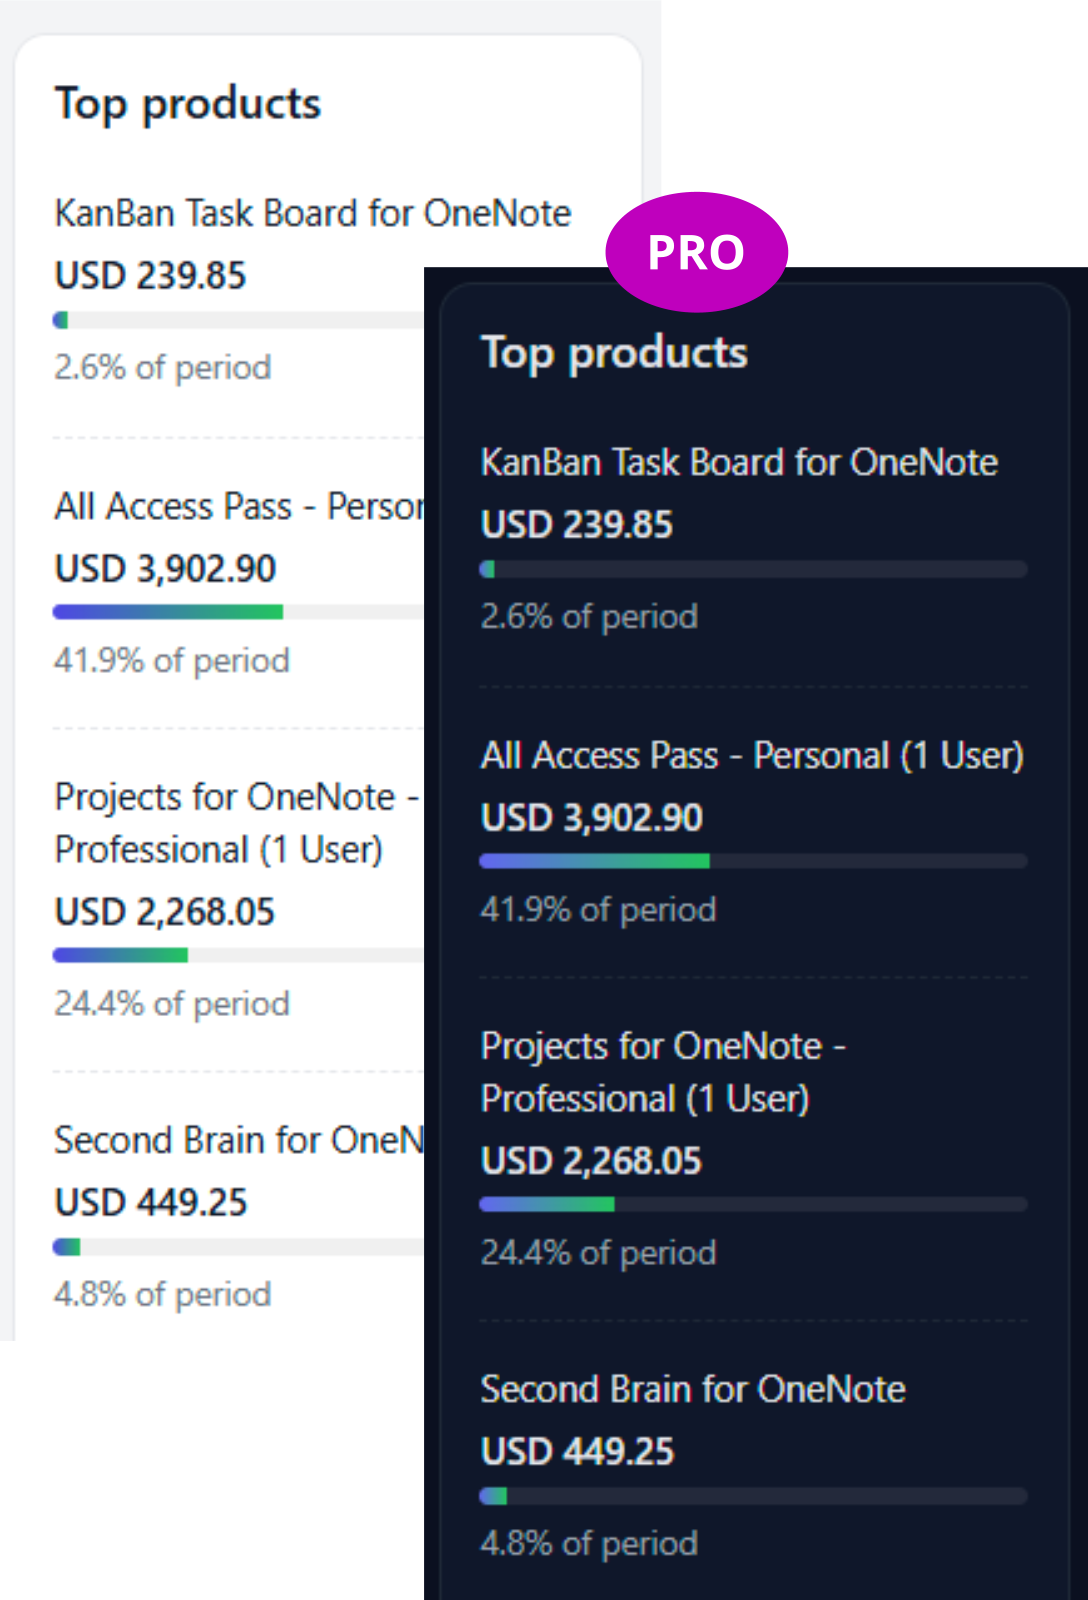
Top Products – Revenue Leaders (PRO Version)

See what’s driving your store’s success.

Identify your best-selling products with revenue share and performance percentages, so you know what to promote and stock up on.

Key points

  • Product-level revenue breakdown
  • Percentage of total sales by product
  • Visual bars for quick comparison
  • Insights into top-performing items

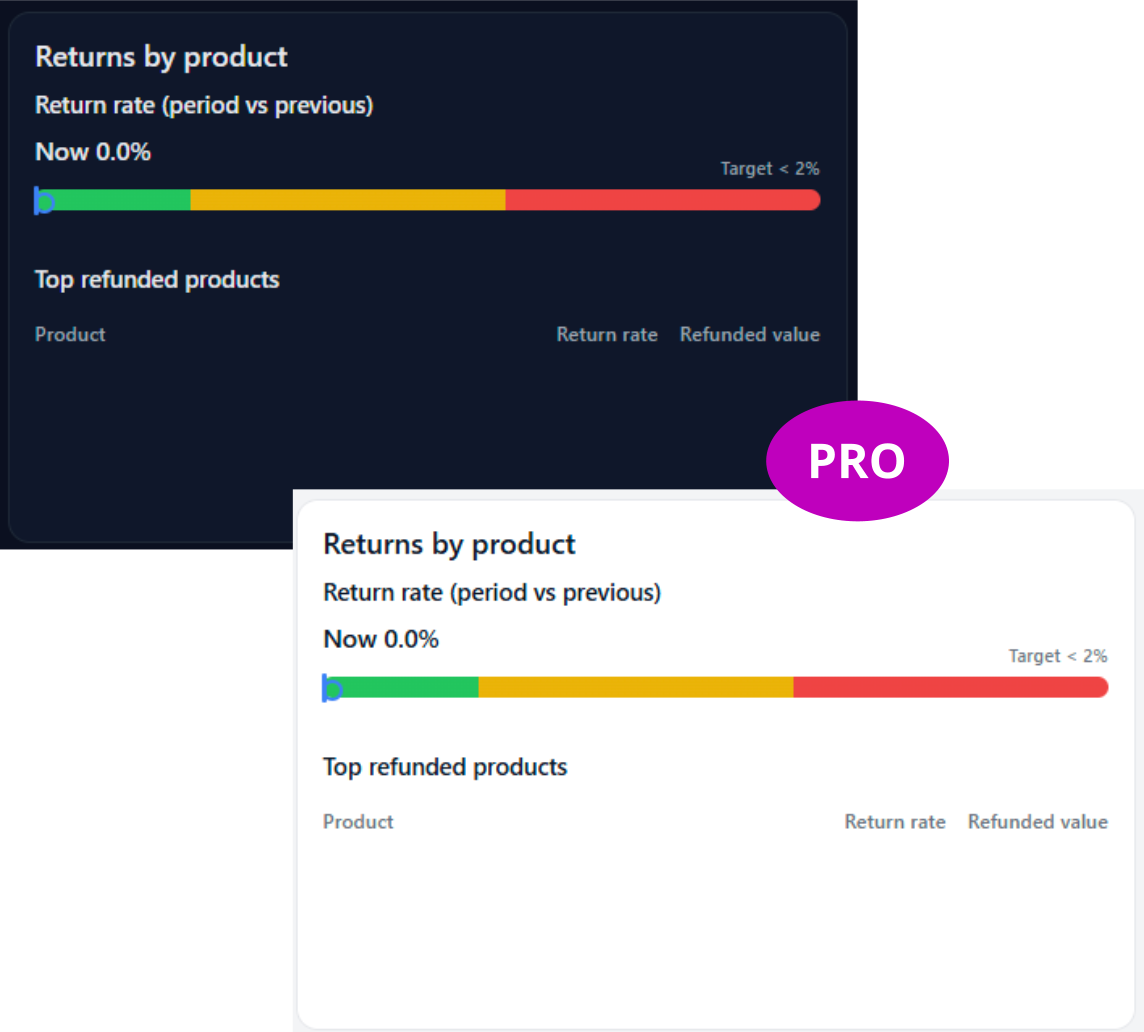
Returns by Product – Refund Hotspot Analysis (PRO Version)

Pinpoint what customers send back.

Track product-level return rates and refunded values to identify problem items and improve product quality or expectations.

Key points

  • Return rate vs target benchmark
  • Comparison between current and previous periods
  • Top refunded products listed by return value
  • Helps reduce costly refunds

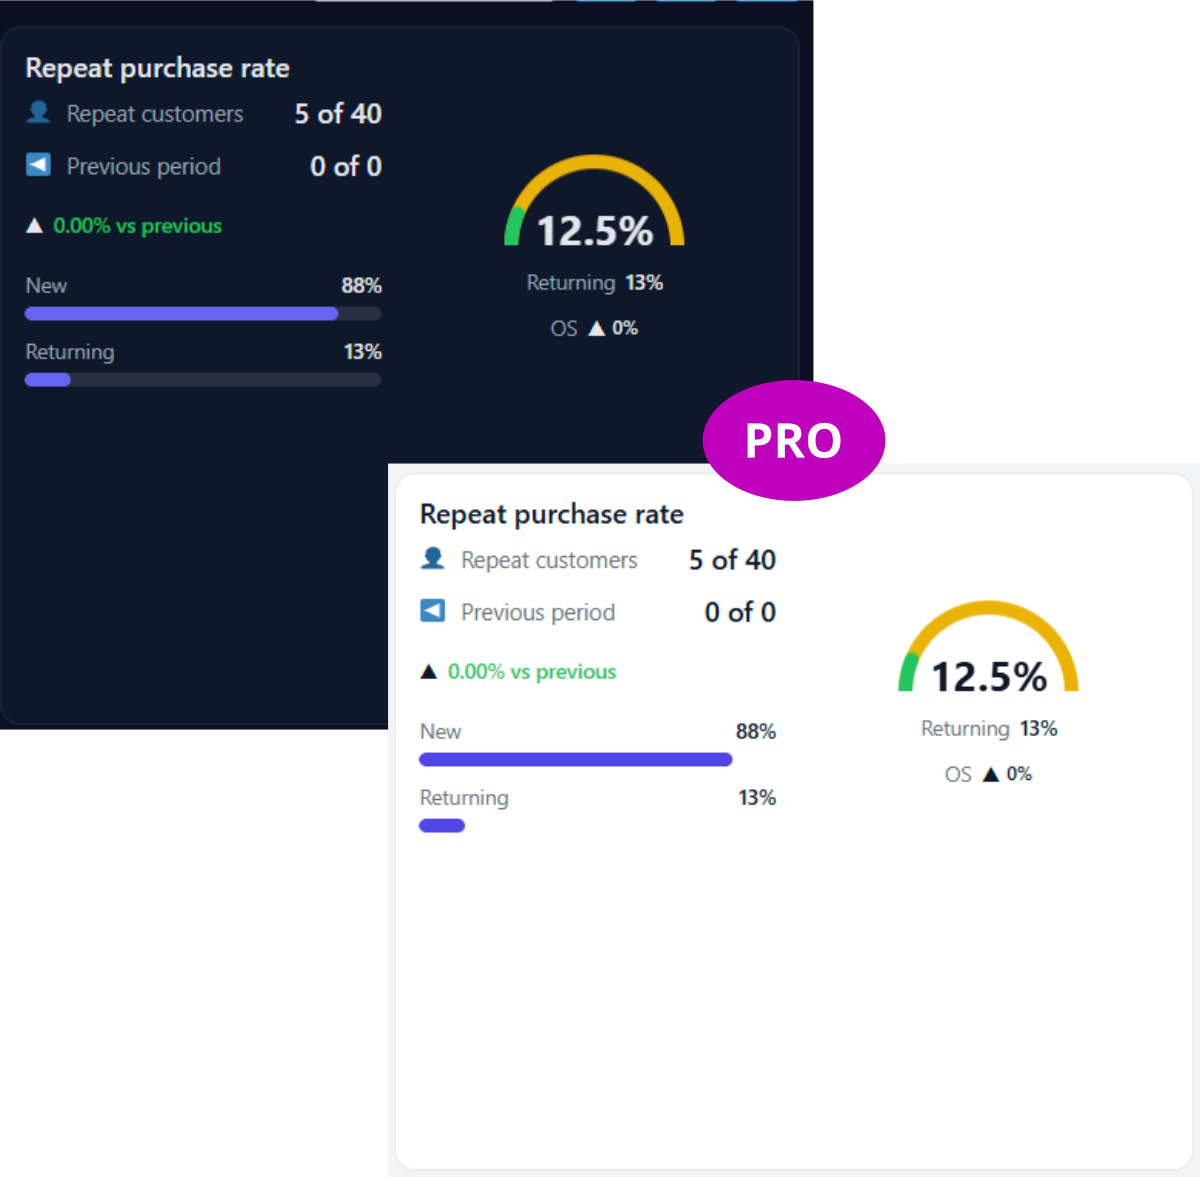
Repeat Purchase Rate – Customer Loyalty Metric (PRO Version)

Know how many customers come back.

Monitor customer retention with a clear view of repeat purchase behaviour. Compare new vs returning customers and measure loyalty trends over time.

Key points

  • Percentage of repeat customers displayed
  • Comparison with previous periods
  • Split between new and returning customer orders
  • KPI gauge for quick trend analysis

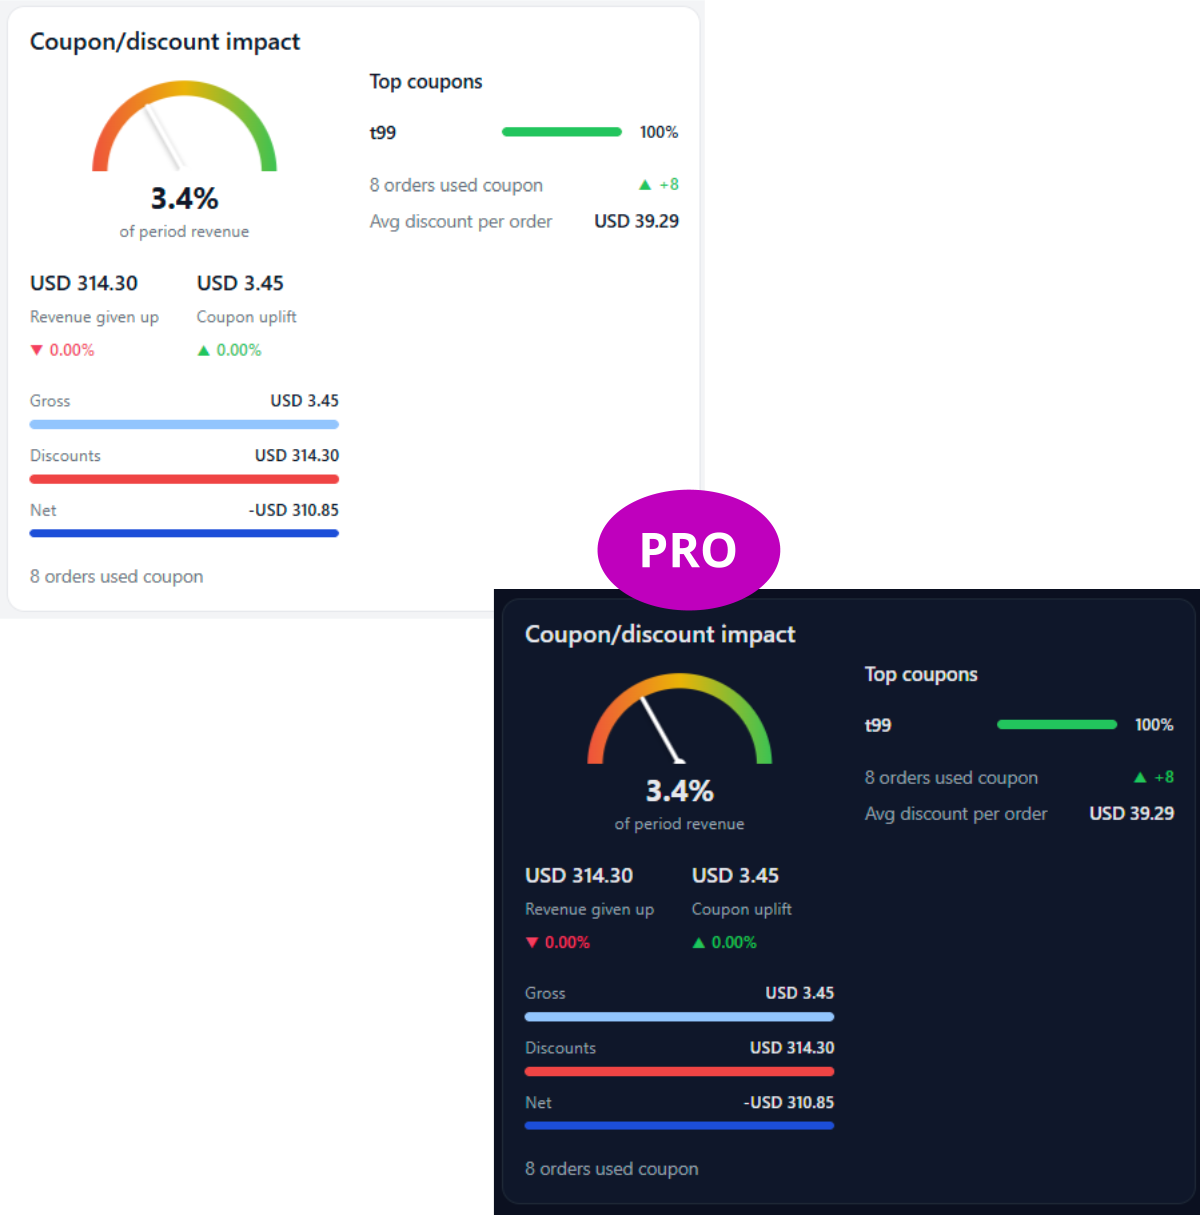
Coupon & Discount Impact – Measure Promotion Effectiveness (PRO Version)

See the real cost of discounts.

Understand how coupons and discounts affect your bottom line. Track revenue given up versus uplift and analyze top-performing coupons.

Key points

  • Gauge showing discount share of revenue
  • Breakdown of gross, discounts, and net value
  • Top coupon usage and average discount per order
  • Insights into promotion efficiency
My Cart
Recently Viewed
Categories